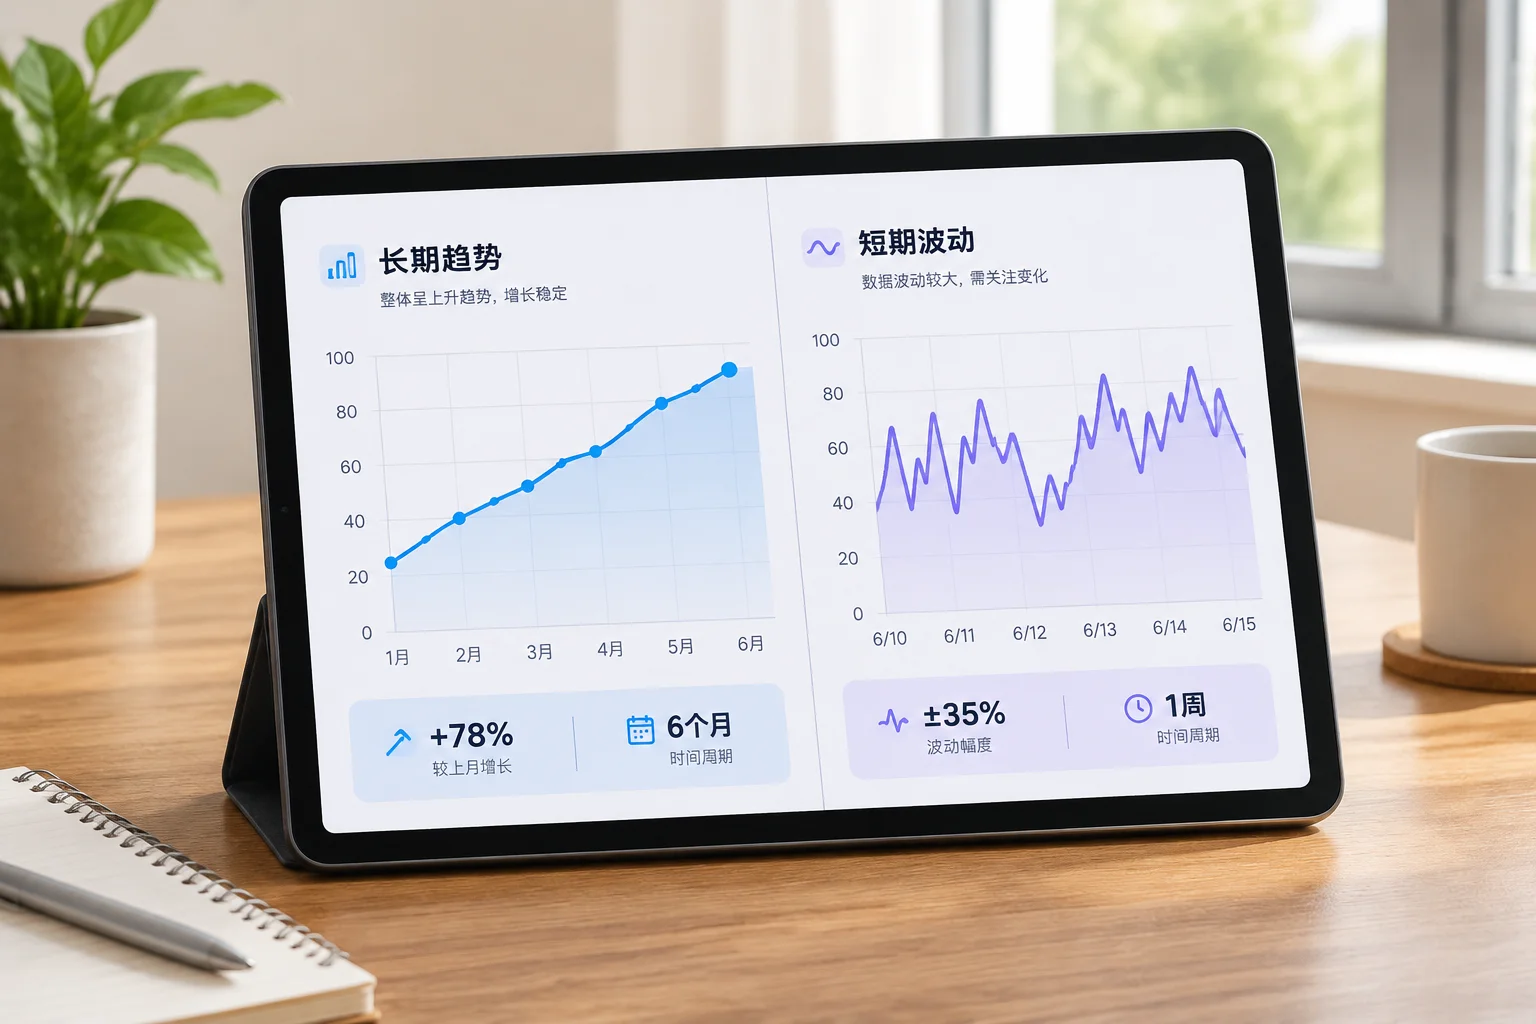
Why Two Timeframes Tell Different Stories
A split-screen view of two abstract data charts on a digital tablet, showing different structural patterns.
Systematic documentation on chart configuration, timeframe behavior, and observation methodologies for structured market reviews.
A split-screen view of two abstract data charts on a digital tablet, showing different structural patterns.

A close-up of a person's hands holding a stylus, pointing at a cluster of data points on a monitor.

A printed chart on a desk with a transparent overlay showing a curved line, illuminated by a desk lamp.

A notebook open to a page with hand-drawn geometric shapes and meticulous handwritten notes.

A wide computer screen displaying a timeline graph that transitions from dark to light background zones.

A drafting compass and a straightedge resting on top of a complex architectural-style blueprint.

Multiple layers of semi-transparent colored glass stacked together, creating complex overlapping hues.

Two identical laptops placed side-by-side on a desk, each displaying a slightly different version of the same dashboard.

A vintage instant camera sitting next to a modern smartphone displaying a digital graph.

A neat clipboard holding a printed checklist with several boxes ticked off with a green pen.
No matching analysis items found. Please refine your search query.
High-quality technical records require separating verified market behavior from prospective interpretations, tracking timeframe aggregation, and locking parameter baselines.
| Parameter | Baseline Setting | Review Observation |
|---|---|---|
| Timeframe Baseline | Daily + Intraday Dual Matrix | Isolates higher-order macro structure from lower-order volatility spikes. |
| Study Calibration | Fixed Parameter Defaults | Disallows curve-fitting studies to retrospectively match idiosyncratic moves. |
| Record Verification | Timestamped Chart Snapshots | Captures static technical context without recalculation bias. |
Clear explanations regarding our analytical framework, study comparisons, and note reproducibility.
Conflating raw price observation with predictive assumptions leads to cognitive bias. Logging what is definitively observed creates an objective dataset that can be reviewed reliably across time.
A 15-minute moving average reflects local momentum, whereas a daily moving average reflects multi-week consensus. Evaluating both simultaneously prevents misinterpreting localized oscillations as broader reversals.
Stacking multiple momentum oscillators (like RSI, Stochastics, and MACD simultaneously) provides redundant feedback derived from identical price data, creating artificial confidence rather than independent confirmation.
Extended trading hours alter volume weight and moving average curves. Maintaining separate views—regular trading hours versus full 24-hour sessions—prevents distorted price-axis benchmarks.
Reach out for technical inquiries regarding chart study setups, platform configuration notes, or our educational review archive.