Knowledge Base2026-10-15
Why Two Timeframes Tell Different Stories
Examining how varying period aggregations transform identical tick structures into opposing market narratives.
Independent chart-literacy guides to aggregation, indicator context, annotated observations, and the limits of visual market analysis.
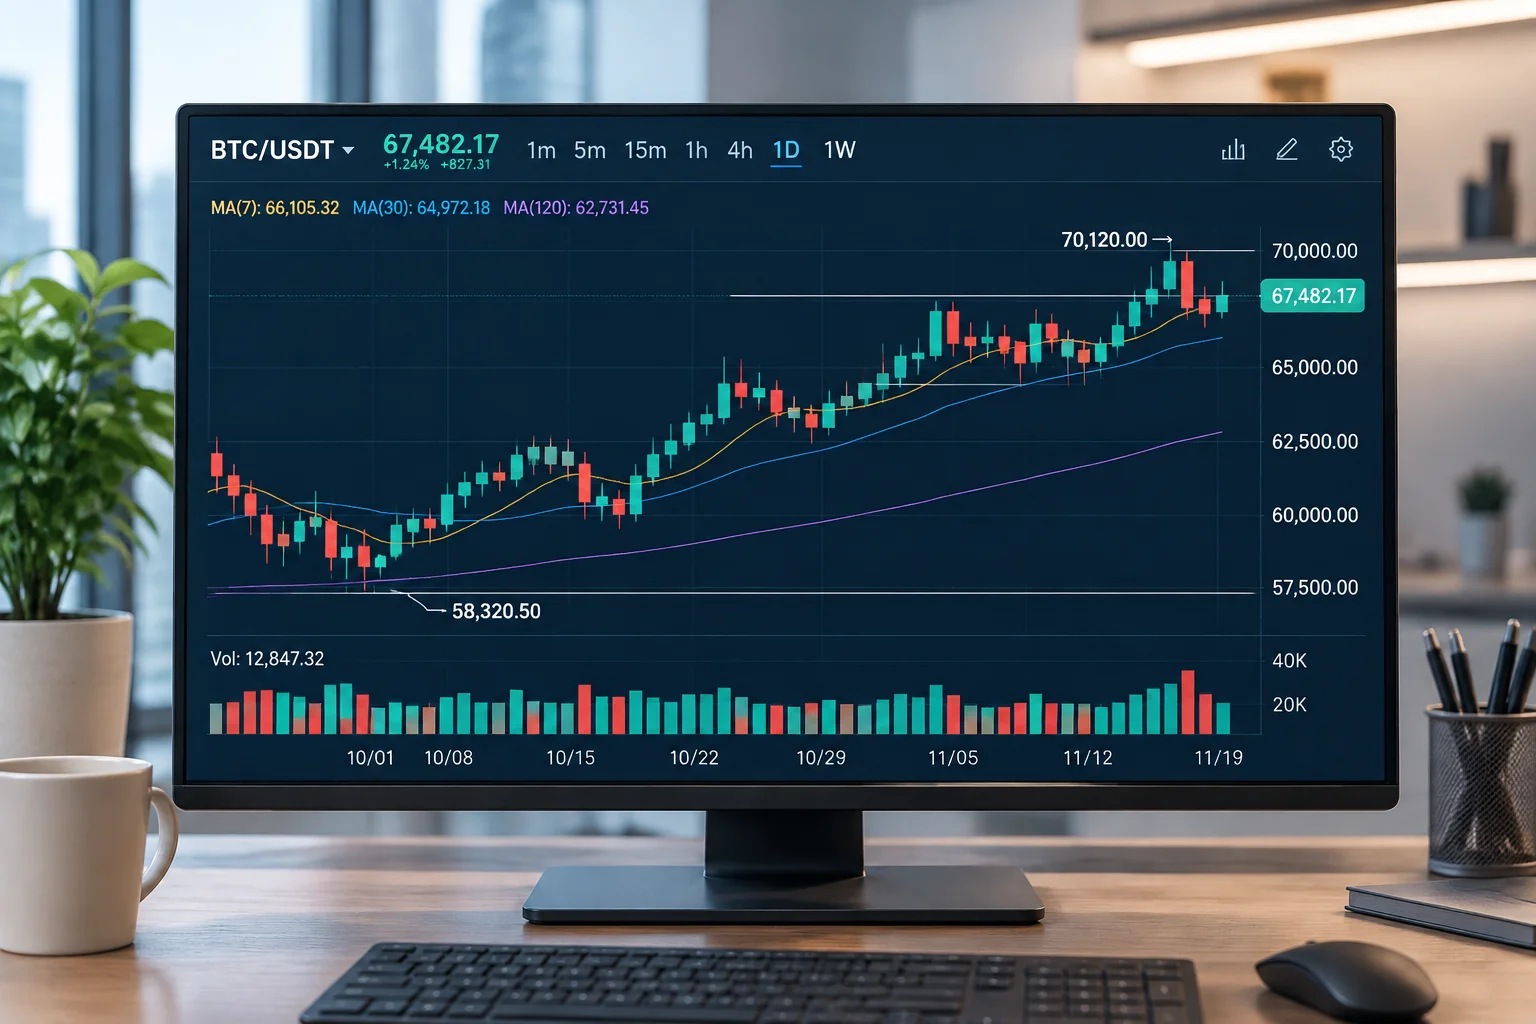
Every financial chart presents an aggregated mathematical projection rather than a raw reality. Understanding its five foundational axes prevents misinterpreting visual artifacts as verified structural behavior.
Individual candlesticks record historical clearing agreements between participants within a bounded period. They represent settled quotes, not forward commitments or order book depth.
Examine ContextChronological spacing organizes continuous auction flow into discrete sampling buckets. Regular trading hours versus extended session displays drastically change bar continuity.
Examine ContextLinear scales measure absolute currency variations, while logarithmic scales display percentage transformations. Scale selection dictates whether a historical movement appears compressed or magnified.
Examine ContextConsolidated tape feeds, direct exchange multicast streams, and broker-filtered ticks process volume prints differently. Apparent gap phenomena often reflect filter settings rather than liquidity voids.
Examine ContextThe lookback horizon establishes the statistical context for moving averages and oscillators. Localized distribution patterns often disappear entirely when evaluated across broader multi-month regimes.
Examine ContextCandlesticks and oscillators illustrate past clearing transactions, not upcoming behavior. Establishing strict documentation standards prevents confusing descriptive math with underlying market causes.
A recurring rebound near a historical moving average does not mean the line caused liquidity to enter. Orders are entered by participants responding to diverse external catalysts, not lines on a grid.
Oscillators such as momentum and range bands are derived purely from past closing bars. They inherently reflect historical dispersion rather than novel liquidity conditions.
When scrolling backwards through settled bars, pivots appear predictable because noise has been stripped away. In live execution, developing candles contain uncalculated outcome distribution.

How extreme band readings frequently persist across trend environments without mean-reverting, challenging traditional oversold assumptions.
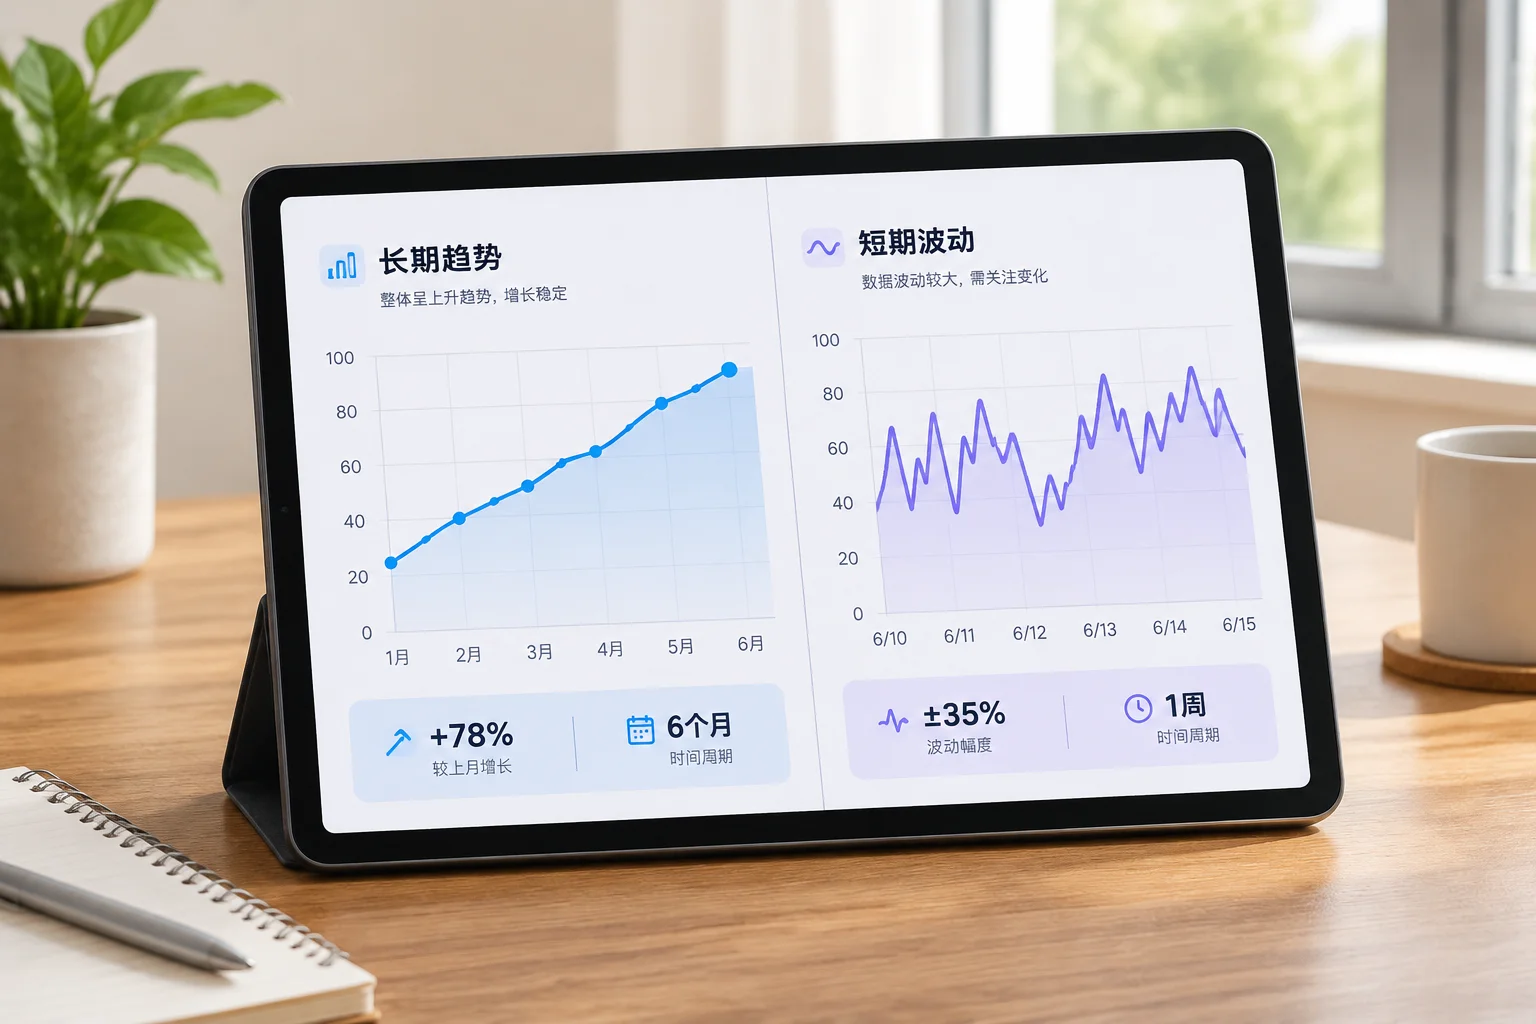
Documenting how discrete interval boundaries transform the perceived structure of an identical synthetic price stream without changing underlying price path data.
Detailed intraday micro-structure revealing swing highs at units 6 and 12 with intermittent 2-bar pullbacks.
Consolidated macro-profile displaying steady upward progression with one central indecision candle.
| Aggregate Window | Initial Level | Peak Value | Trough Value | Final Level | Synthetic Momentum |
|---|---|---|---|---|---|
| Cluster 01 (Units 01-04) | 100.20 | 105.80 | 99.40 | 104.90 | +4.70 pts |
| Cluster 02 (Units 05-08) | 105.10 | 108.40 | 102.10 | 103.50 | -1.60 pts |
| Cluster 03 (Units 09-12) | 103.80 | 111.60 | 103.20 | 110.80 | +7.00 pts |
When grouping begins at unit 1 versus unit 2, the resulting high and low extremes remain identical, yet open-close wick geometry shifts visibly.
A prolonged 4-step lateral oscillation in higher-frequency records is compacted into a single standard body in the 4-unit aggregated view.
Intra-interval reversals appear as continuous trends on finer charts but condense into single extreme rejection wicks on aggregated timeframes.
When recording quantitative chart notes, analysts often treat candlestick shapes as absolute signals. In this controlled synthetic environment, both panels show the identical mathematical trajectory sampled under two distinct binning frequencies.
Objective documentation separates verifiable chart geometry from speculative projections. Every recorded annotation belongs strictly to one of three categories: descriptive facts, falsifiable conditions, or systemic constraints.
Price closed above the 20-period moving average on 270k volume, which registers 22% higher than the preceding 5-session average. No trend directional claim is made.

An applied audit examining how indicator lag and parameter choices impact visual convergence before confirmation.
A methodical breakdown of workspace mechanics, multi-timeframe aggregation synchronization, the Charles Schwab infrastructure integration, and the emerging late 2026 AI assistant rollout.
Charting on thinkorswim separates drawing groups by symbol and aggregation period. Analysts can maintain separate trendlines, Fibonacci grids, and horizontal reference bands across intraday and daily charts without cluttering longer-term records.
Following the full Charles Schwab technical integration, thinkorswim operates on an upgraded data backbone. Traders benefit from unified balance synchronization, low-latency market depth feeds, and direct routing infrastructure across desktop, web, and mobile layouts.
The late 2026 assistant release integrates contextual machine intelligence into the desktop client. Designed specifically for technical analysts, the assistant parses study parameter discrepancies, audits chart notes against historical bar patterns, and summarizes cross-timeframe volume profile shifts in plain text.
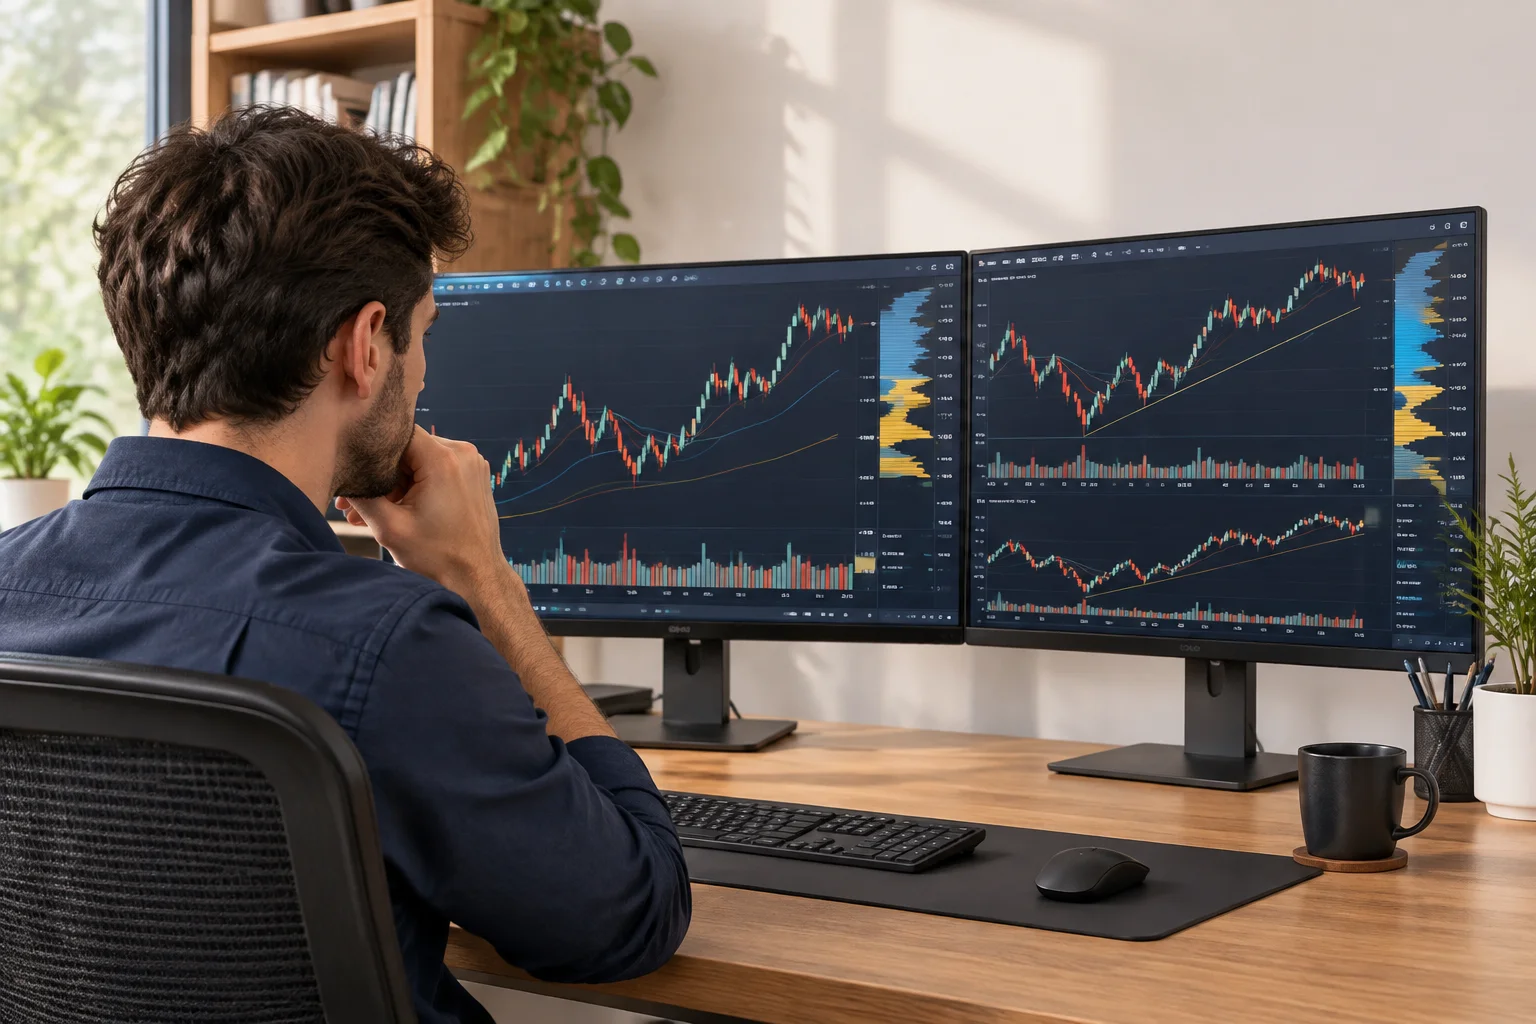
Read our structured breakdown covering workspace profiles, volume profile anchors, study optimization, and reliable chart notation workflows.
A rigorous, reproducible environment for charting observations requires stable desktop workspaces, explicit aggregation boundaries, and structured visual logs.
Desktop platforms such as thinkorswim support high-precision script definitions, custom aggregations, and layout presets without interpolation distortion.
Parametric mathematical overlays including RSI baselines, volume profile histograms, and MACD differential limits logged with fixed input parameters.
Structured screen-capture procedures retaining crosshair coordinates, session scale parameters, and extended-hours flags for unbiased back-review.
Markdown documentation records distinguishing direct price observations from speculative projections, indexed by ticker, timeframe, and study setup.
Documenting setups across fragmented platforms risks observational mismatch. Standardizing your study inputs, color-coded boundaries, and timeframe synchronizations preserves empirical accuracy over years of historical logging.
Step-by-step walkthrough covering thinkorswim chart settings, drawing tools, and study parameter alignments.
Read Setup ReviewExplore how structured observation markers, study baselines, and multi-timeframe notes are recorded without forecasting assumptions.
Eliminate hindsight bias and ambiguous chart reviews. Receive our structured, field-tested verification protocol to document exact timeframe relationships, indicator baseline states, and structural price pivots before journaling.

Precise, single-line reference definitions designed to clarify core recording standards and eliminate ambiguity across personal charting workflows.
Grouping continuous trade ticks into distinct time-based or volume-based intervals to normalize chart comparison.
The surrounding higher-timeframe market structure and volume condition against which an isolated candle formation is assessed.
The disciplined notation of verified empirical price behavior on the chart without inserting speculative future bias.
A calibrated arithmetic average or equilibrium line serving as a reference point for calculating momentum extension.
The explicit line separating standard liquid market hours from low-participation pre-market and post-market trading spans.
Overlaying multiple technical studies that rely on identical moving averages or momentum formulas without additive value.
A visible consolidation in candle spread and true range that consistently precedes an expansion in trading participation.
Documenting charting studies and scale settings with complete precision so another analyst can replicate the identical view.
A four-phase operational procedure for recording context, verifying indicator assumptions, and archiving charts without hindsight bias.
Establish the macro perspective before zooming into immediate intervals. Verify session boundaries and calendar aggregation.
Log exact parameters for each applied study. Ensure calculation inputs match cross-layout benchmarks.
Annotate factual technical occurrences on the drawing layer. Separate empirical price behavior from prospective scenarios.
Export high-resolution uncompressed chart frames with metadata timestamps and reproducible layout links.

Consistent capture protocols guarantee that retrospective evaluations assess the chart exactly as it stood at the execution moment. Learn how systematic documentation preserves contextual nuance across market regimes.
Read Full GuideStructured field notes detailing timeframe comparisons, chart aggregation dynamics, and non-predictive indicator documentation.
Examining how varying period aggregations transform identical tick structures into opposing market narratives.
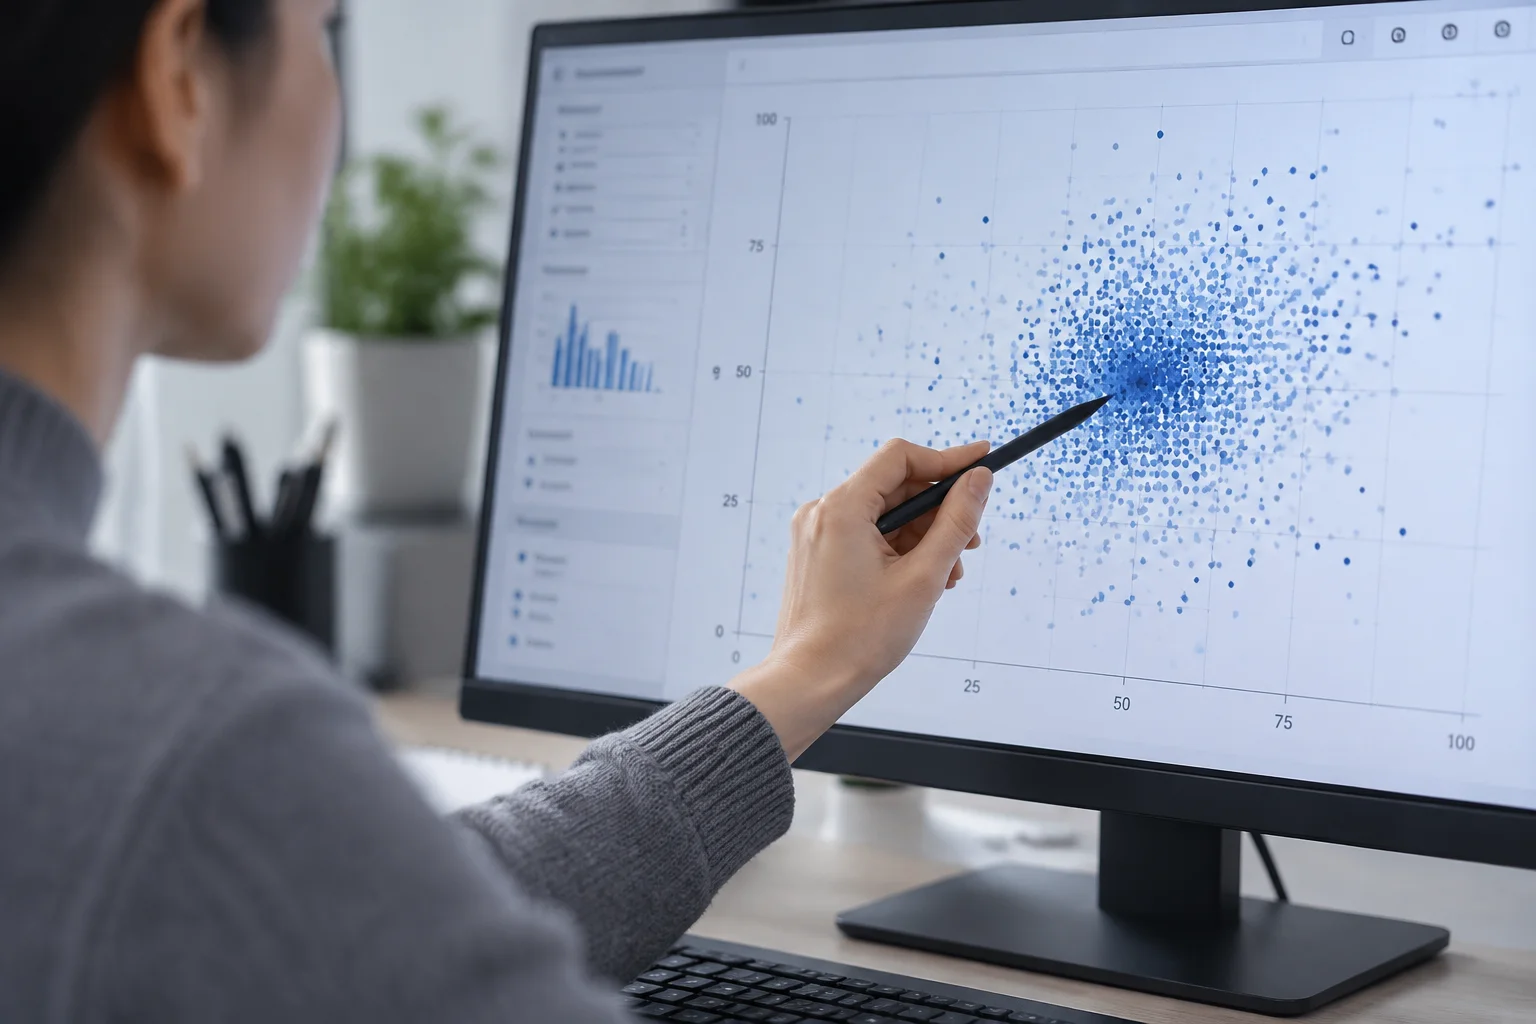
Why recording data grouping parameters must precede any technical review or charting notation exercise.

Isolating length, smoothing type, and session boundaries to avoid assigning false importance to simple curve intersections.