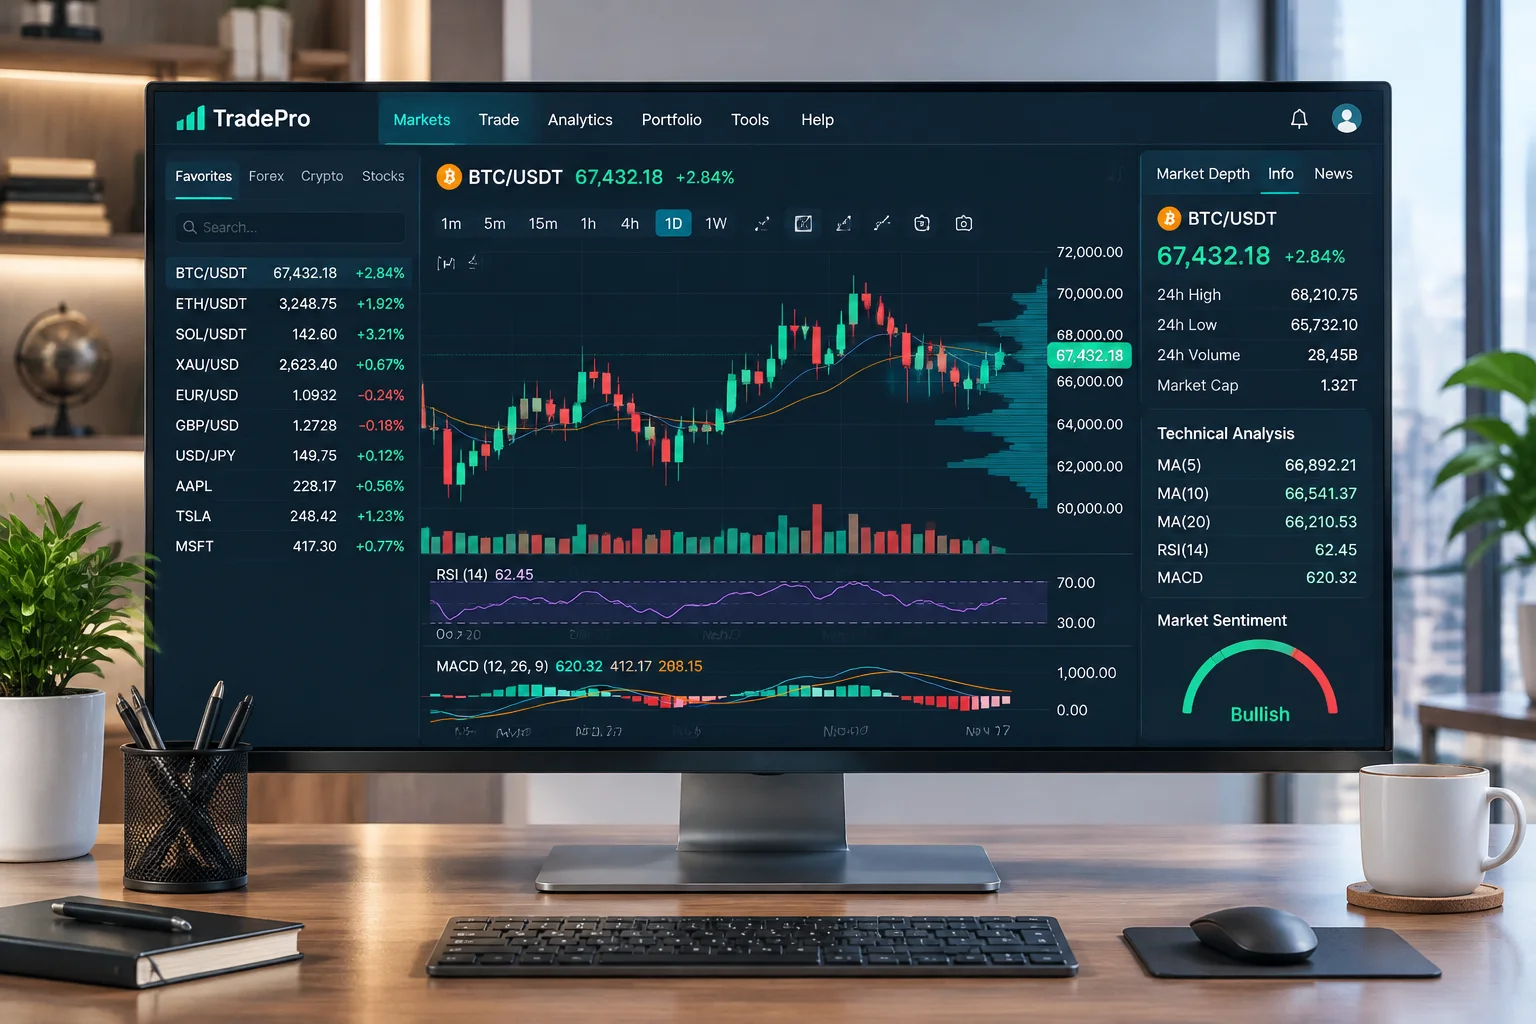
Charts as a Visual Analysis Workspace
Beyond Simple Price Observation
In professional research routines, charting software functions as a visual ledger for empirical data rather than an oracle of market direction. The desktop interface provides multilayered aggregation intervals, customizable overlays, and systematic chart grid synchronizations that allow researchers to map structural tendencies without speculative bias.
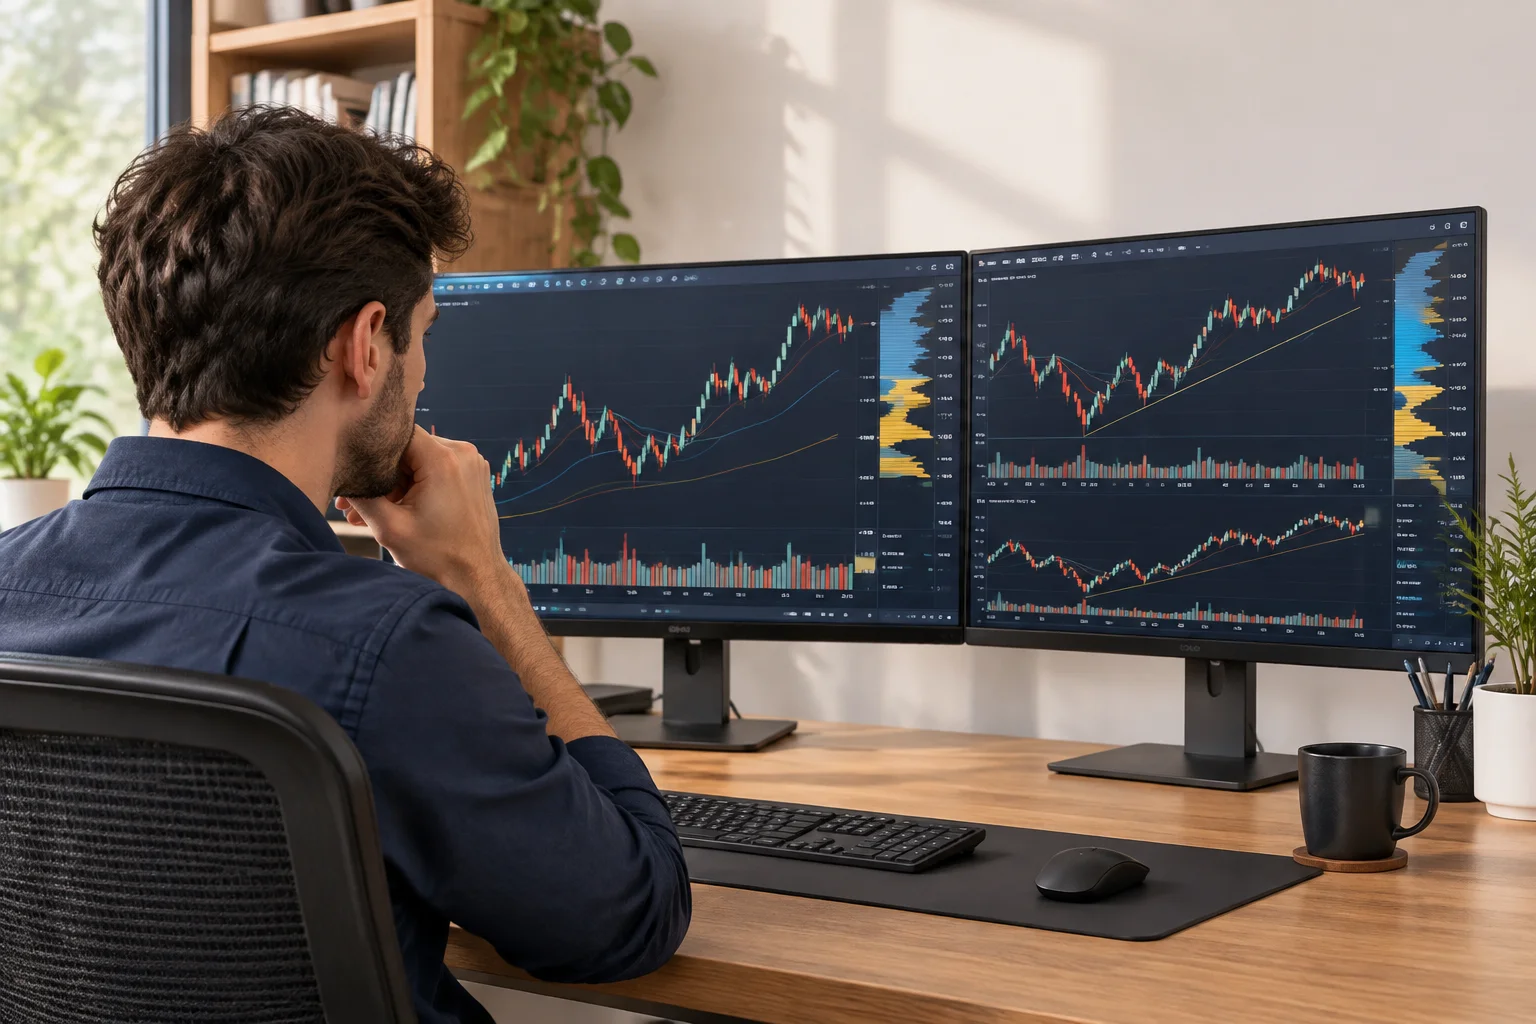
Time Frame and Aggregation Settings
Aligning Bars with Objectives
Bar aggregation dictates data granularity and noise reduction. Choosing inappropriate combinations obscures underlying auction mechanics and leads to false regime classifications.
Tick & Volume Bars
Aggregates bars solely upon transaction count or traded contracts rather than elapsed clock seconds. Eliminates flat stretches during lunch hours and captures microstructural acceleration during opening auctions.
Intraday Minutes (1m–60m)
Standard temporal discretization for measuring session VWAP bands, initial balance boundaries (first 30 or 60 minutes), and rotational extensions during normal market hours.
Daily & Weekly Aggregations
Captures institutional macro positioning, structural swings, and volume distribution profiles across multi-month holding cycles, shielding analysts from transient intraday spikes.
Comparing Two Chart Configurations
Intraday Execution vs. Regime Mapping
Examine how parameter adjustments change analytical intent across different operational timeframes. Toggle between profiles to contrast workspace requirements.
Day Structural Execution
Optimized for identifying intraday inventory imbalance, test of prior session value areas, and liquidity sweeps.
- VolumeProfile: Session by Session mode.
- VWAP: Showing 1st and 2nd standard deviation bands.
- ATR (14): Gauging current bar expansion relative to baseline.
Record regular market open (09:30 ET) response, initial balance high/low, and directional volume skew by 11:30 ET.
Study Documentation DetailsMulti-Week Regime Mapping
Focuses on long-range distribution curves, weekly auction highs/lows, and broad market breadth parameters.
- SimpleMovingAvg: 50, 100, and 200 periods.
- Composite Volume Profile: 1-Year aggregate distribution.
- Bollinger Bands: 20 periods, 2.0 std deviations.
Catalog weekly closes against dominant high-volume nodes (HVN) and note ongoing quarterly trend persistence.
Study Documentation Details
Study Selection and Parameter Notes
Preventing Curve Fitting
Adding technical overlays without written calibration standards leads to analysis paralysis and cognitive bias. In thinkorswim, every active script must have documented rationale for each non-default input value.
Verify whether value area percent is fixed at 68% (standard deviation) or 70%. Never toggle row counts arbitrarily between sessions.
Check extended session inclusions. A 24-hour VWAP baseline varies substantially from a regular-trading-hours (RTH) anchored baseline.
Drawing Tools and Annotation Limits
Visual Hygiene on Monitors
Freehand trendlines and diagonal channels are susceptible to chart scaling distortions (linear vs. logarithmic axes). Enforce rigorous drawing constraints to maintain objective review criteria.
The 5-Line Ceiling Rule
Limit active discretionary drawings to no more than five distinct price levels per chart tab: Previous Day High/Low, Session Open, High Volume Node, and One Major Structural Swing Pivot.
Snap-to-Price Requirement
Activate magnetic snapping for horizontal price levels. Freeform visual approximation introduces systematic anchor drift over multi-week reviews.
Saving a Chart Context Record
Consistent review logs convert fleeting visual impressions into verifiable post-market datasets. Complete this four-field audit whenever a critical setup develops.
Timestamp & Underlying
Log exact hour, minute, symbol, and whether current market phase is RTH or extended 24-hour liquidity.
Aggregation Setting
Record exact bar geometry (e.g. 15-min / 20-day) to guarantee identical reconstruction in historical replays.
Indicator State Summary
Note numerical values (VWAP deviation status, relative volume ratio, RSI band) rather than vague opinions.
Export & Categorize
Save workspace snapshot directly to your local journal folder tagged by market regime classification.
What Chart Tools Cannot Establish
The Limits of Technical Displays
A clean chart visualizes historical and instantaneous auction transactions. It does not display unpublished iceberg orders, non-displayed dark pool matching, or macroeconomic headline triggers.
- Future Price Trajectory: Technical charts record historical transactions. Historical patterns do not compel future order flow.
- Execution Fill Quality: Spreads widen drastically outside regular hours, causing slippage that charts cannot portray accurately.
- Risk Allocation Logic: A moving average crossover offers zero guidance on appropriate position size or stop distance.
Charles Schwab 24/5 Scope & 2026 AI Coaching Features
The integration under Charles Schwab expands continuous 24/5 trading capabilities across a wider selection of equities and index instruments. In addition, 2026 platform developments incorporate automated analytical coaching scripts and AI assistance modules.
Continuous session quotes present fragmented liquidity and erratic spreads. Even with 2026 AI coaching tools surfacing calculated patterns, users must independently verify liquidity conditions and maintain manual operational safeguards.
Note: ChartContext Notebook does not integrate live execution widgets or commercial proprietary trading scripts.
Independent Publication and Financial Risk Disclosure
ChartContext Notebook is an independent educational and research platform. We are not affiliated with, sponsored by, or endorsed by Charles Schwab, TD Ameritrade, or the thinkorswim trading platform. All product names, trademarks, and registered trademarks belong to their respective holders.
All content, indicator definitions, and chart parameters presented here are strictly for educational and informational reference. Trading equities, futures, and derivative securities involves substantial capital risk and is not suitable for every participant. Please review our Disclaimer and Terms of Use.